Tag Archives: oceanography

Check out some of the prettiest (and most depressing) climate change data out there

7 ways of looking at a climate

Check out some of the prettiest (and most depressing) climate change data out there

By on 24 Oct 2015commentsShare

Given ever-worsening hurricane news, the hottest September on record, and GOP obstructionism, it can be hard to get a handle on what’s even going on with our climate. There’s a lot of data out there — sometimes it can seem like too much — and a lot of it is unreliable. Climate data visualizations can help you sort through the noise to get at the signal.

Over at Climate Home, Megan Darby has compiled a veritable cornucopia of climate change data tools. It’s a stellar list, and if you’re looking for a deep data dive, you’d do well to check it out. But here at Grist we love data, too, and so we decided to put together our own compilation for your visualizing pleasure.

Without further ado, here are seven tools to help you hold a climate conversation without having to lean on the weather. (Unless, of course, you’re talking about NOAA’s Climate and Weather Toolkit, in which case you’ll really be talking about the weather.)

The 30,000-Foot ViewGlobal Top 10 Greenhouse Gas Emitters (World Resources Institute)

The World Resources Institute’s CAIT project is the classic starting spot for historical emissions data. One tool we’re particularly fond of is the global emissions profiler embedded above. It’s particularly useful if you’re trying to get a sense of scale. How much is a hundred million metric tons of CO2 equivalent, anyway? Scroll around the wheel — it’s about the same size as the entire Chilean economy. CAIT also hosts a domestic state-by-state comparison tool.

The Bare Bones: The Keeling Curve (Scripps Institution of Oceanography)

Scripps Institution of Oceanography

In the world of climate data, there are technocrats and there are Luddites. The classic Keeling Curve is of the latter variety. It’s nothing fancy, but it gets to the root of the climate dilemma. The Mauna Loa Observatory started collecting atmospheric CO2 data in 1958, and the numbers have been climbing ever since. Wondering about that 350 ppm number people are always tossing around? We’re well past it.

The Metavisual: A World of Change (Google)

This is what we talk about when we talk about climate change. Google’s A World of Change tool allows people to get a handle on global search trends for environmental information. In addition to being rather pretty, the tool offers several crucial insights into the way different countries approach the idea of global warming. “We wanted to show how this big issue looks when viewed through the lens of Google search data,” Simon Rogers, data editor of Google News Lab told the Washington Post. “Google data is so big — there are over 3 billion searches a day — that our challenge was how to make those huge numbers meaningful.” You can decide whether or not they succeeded.

The Wonk’s Paradise: Energy Policy Simulator (Energy Innovation)

Energy Innovation

Climate Home also flagged this bad boy. Fresh off the press (the tool launched earlier this week), Energy Innovation’s Energy Policy Simulator lets you design your own U.S. energy policy suite and come to grips with the resulting emissions projections. What’s truly astounding about the simulator is the staggering degree of detail. “The desktop version allows even more policy options,” wrote POLITICO’s Eric Wolff in Morning Energy. “Considering that the web tool allows users to devote research money to reducing livestock flatulence, ME’s mind boggles at what would be more detailed.”

The Tree Hugger’s Terror: GFW Interactive Map (Global Forest Watch)

Global Forest Watch

Worried about deforestation? About land and resource rights? Carbon stocks and biodiversity? Global Forest Watch has got you covered. Earlier last month, the NGO reported that the Google-hosted tool helped pinpoint new hotspots of tree-cover loss. They’re constantly updating the data, so keep checking back for all your arboreal needs.

The Pretty One: Global Land Temperatures (Halftone)

Halftone

Halftone’s land temperature visualizer might not be the most practical tool in the world, but it’s divinely gorgeous. Visit the online version for all the beautiful, time-dependent, temperature-indicating Voronoi tessellations you could ever want.

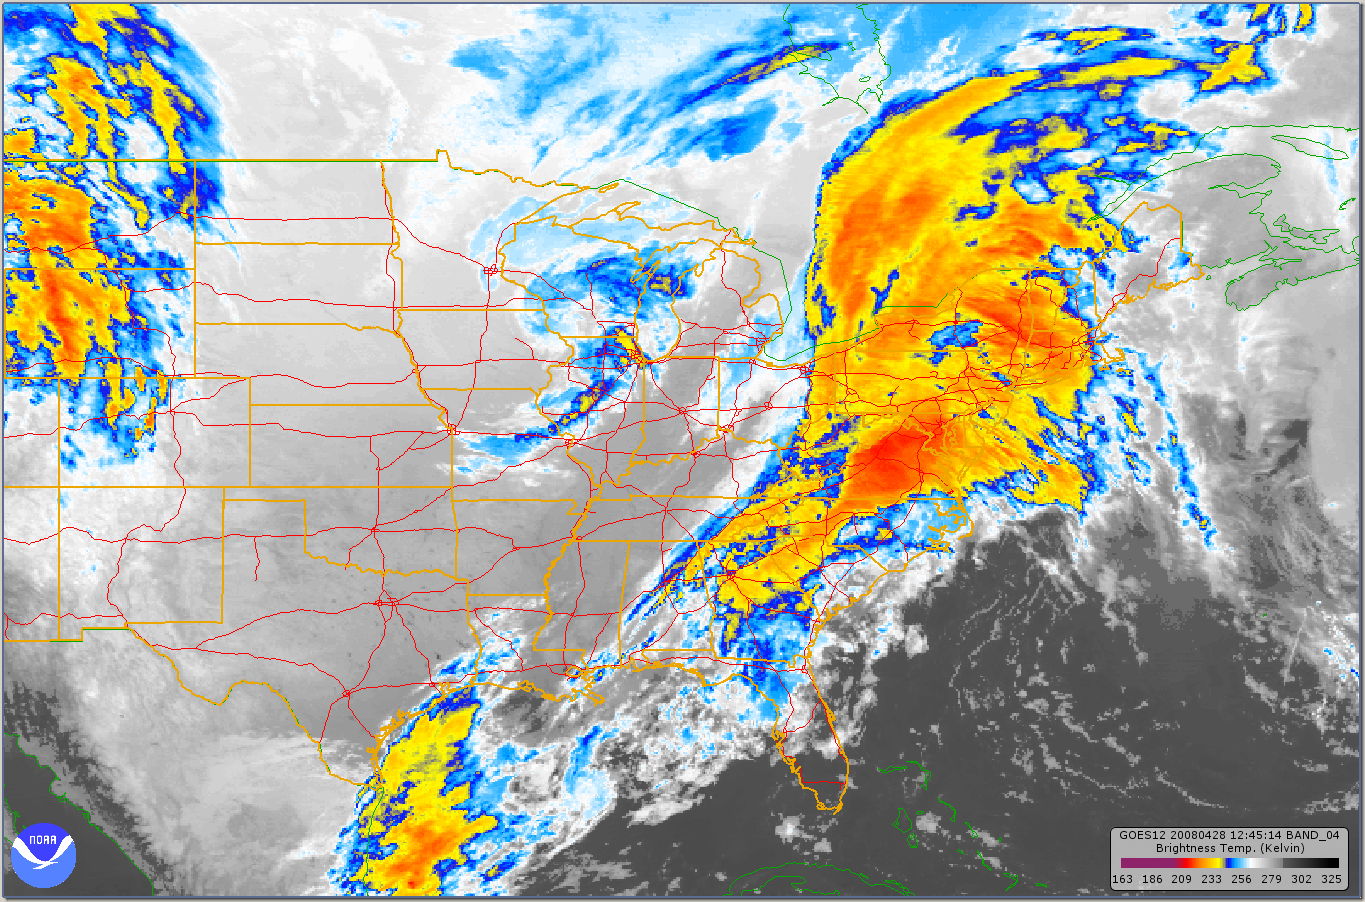
The Doozy: Weather and Climate Toolkit (NOAA)

NOAA

And then there’s the tool for the hotshots. The big guns. Want the real deal? Access to more or less every climatic and meteorological variable under the sun? Then you want the National Oceanic and Atmospheric Administration’s Climate and Weather Toolkit. Warning: It’s not for beginners. But you’re no beginner, are you? Check out this video introduction to the software.

That’s all for now, team. Let us know what we missed.

Source:

7 climate change data tools and what they tell you

, Climate Home.

Share

Find this article interesting?

Donate now to support our work.

Please

enable JavaScript

to view the comments.

Get Grist in your inbox

Advertisement

Jump to original:  

Check out some of the prettiest (and most depressing) climate change data out there

Posted in Anchor, FF, GE, LG, ONA, Paradise, Radius, Uncategorized | Tagged , , , , , , , , , | Comments Off on Check out some of the prettiest (and most depressing) climate change data out there

These are dark days for the Arctic — literally

These are dark days for the Arctic — literally

Sarah Sonsthagen / U.S. Geological Survey

Things are getting gloomy up north, where the Arctic region is losing its albedo.

No, not libido — this isn’t a problem that can be fixed with ice-blue pills and adventurous nature videos. Albedo. It’s a scientific term that refers to the amount of light that the surface of the planet reflects back into space. Reflecting light away from the Earth helps keep things cool, so the loss of Arctic albedo is a major problem.

And new research has concluded that the problem is an even greater one than scientists had anticipated.

Researchers from Scripps Institution of Oceanography used satellite measurements to discover that the region is darker than it was in the halcyon days of the late ’70s. Back then, Arctic temperatures were nearly 4 degrees F cooler on average and reflective summertime ice covered 40 percent more of the ocean than it does now. And back then, 52 percent of the sun’s rays bounced off the Arctic’s surface, while 48 percent were absorbed. By 2011, those figures had reversed — 48 percent of sunlight was being reflected away and 52 percent was being absorbed.

The drooping albedo is a consequence of climate change. And the region’s changing complexion is also accelerating the rate at which the world is warming. According to the scientists’ calculations, published in a new paper in the Proceedings of the National Academy of Sciences, the amount of extra energy accumulating on Earth because of declining Arctic albedo is equivalent to about a quarter of the amount of extra energy trapped here during the same period by the rise in carbon dioxide levels.

“We’re not really analyzing the subsequent increase in temperature,” Ian Eisenman, one of the authors of the paper, told Grist. “But that is an expected consequence of the increased absorption of solar energy.”

It’s not just melting snow that’s causing the top end of the Earth to darken. Eisenman said the influence of soot and other pollution settling on the snow and ice may also be important.


Source
Observational determination of albedo decrease caused by vanishing Arctic sea ice, Proceedings of the National Academy of Sciences,

John Upton is a science fan and green news boffin who tweets, posts articles to Facebook, and blogs about ecology. He welcomes reader questions, tips, and incoherent rants: johnupton@gmail.com.

Find this article interesting? Donate now to support our work.Read more: Climate & Energy

See the original article here: 

These are dark days for the Arctic — literally

Posted in alo, Anchor, FF, GE, Hagen, LG, ONA, solar, Uncategorized, Waterless | Tagged , , , , , , , , , , | Comments Off on These are dark days for the Arctic — literally

Barnacles are accidentally eating our plastic trash

Barnacles are accidentally eating our plastic trash

thaths

Gooseneck barnacles attached to a washed-up boot.

Barnacles in the Great Pacific Garbage Patch are attaching themselves to trash and eating little plastic particles. Researchers don’t yet know the implications of these findings, but it’s a safe bet that they’re not good.

American scientists inspected the gastrointestinal tracts of 385 gooseneck barnacles collected from the garbage patch, aka the North Pacific Subtropical Gyre, and found microplastic in a third of them. Some specimens had a single piece of plastic in their stomach, while others had gobbled down as many as 30. Results of this research were published Tuesday in the journal PeerJ.

Miriam Goldstein of the Scripps Institution of Oceanography described her research in the blog Deep Sea News:

Gooseneck barnacles look kind of freaky. Like acorn barnacles (the ones that more commonly grow on docks), they’re essentially a little shrimp living upside down in a shell and eating with their feet. Unlike acorn barnacles, gooseneck barnacles have a long, muscular stalk. …

[E]ventually I found myself in the lab dissecting barnacles in order to identify them. As I sat there, I thought “Well, I’m working on these barnacles anyway — wonder what they’re eating?” So I pulled out the intestine of the barnacle I was working on, cut it open, and a bright blue piece of plastic popped out. I reached into my jar o’ dead barnacles and dissected a few more, and found plastic in their guts as well.

Thinking about it logically, it makes a lot of sense that gooseneck barnacles are eating plastic. They are really hardy, able to live on nearly any floating surface from buoys to turtles, so they’re very common in the high-plastic areas of the gyre. They live right at the surface, where tiny pieces of buoyant plastic float. And they’re extremely non-picky eaters that will shove anything they can grab into their mouth.

Simon_Nathan

Gooseneck barnacles look freaky when they come out of their shells.

The barnacles are eaten by crabs, nudibranchs, and other marine creatures that are hunted, in turn, by birds, fish, and dolphins. Such plastic is known to block the digestive systems of these larger creatures, wreak havoc with their hormone levels, and damage their reproductive organs.

As Goldstein says, it shouldn’t come as a huge surprise to learn that barnacles are eating the ubiquitous plastic waste. One 2006 study estimated that at least 267 sea-faring species had been found to have ingested such trash.

Here’s what some of the plastic barnacle food looked like. Perhaps they mistook our garbage for Lucky Charms breakfast cereal. It’s hard to say which is worse for you, really:

PeerJBarnacle diet.


Source
Behind the scenes: plastic-eating barnacles in the North Pacific Gyre, Deep Sea News
Gooseneck barnacles (Lepas spp.) ingest microplastic debris in the North Pacific Subtropical Gyre, PeerJ

John Upton is a science fan and green news boffin who tweets, posts articles to Facebook, and blogs about ecology. He welcomes reader questions, tips, and incoherent rants: johnupton@gmail.com.

Find this article interesting? Donate now to support our work.Read more: Living

More here: 

Barnacles are accidentally eating our plastic trash

Posted in Anchor, Dolphin, FF, G & F, GE, ONA, solar, Uncategorized | Tagged , , , , , , , , , , , | Comments Off on Barnacles are accidentally eating our plastic trash